Leveraged ETFs usually target a multiple of a benchmark’s daily return. They do not promise the same multiple of its return over a month or a year. Because the exposure resets and returns compound, the path taken by the benchmark can change the result substantially.
The easiest way to understand that risk is to calculate a few paths. This guide uses simplified examples that assume perfect achievement of the daily target and ignore fees, financing and tracking differences. Those assumptions make the mechanism visible; real products add further costs and uncertainty.
Read the objective’s time period
A fund described as 2x may seek twice the daily return of its benchmark. An inverse fund may seek the opposite of the daily return, while a leveraged inverse fund combines those ideas.
The SEC’s updated investor bulletin of 29 August 2023 warns that performance over longer periods can differ significantly from the stated daily objective. It also explains that these products can expose investors to substantial losses.
The word daily is therefore part of the investment objective, not a minor qualification. Read the prospectus for the exact benchmark, multiplier, reset period and instruments used.
Do not infer the objective solely from a ticker or a short product name. Some exchange-traded products have different structures and protections, so identify the actual legal product as well.
Follow a rise and a return to the starting point
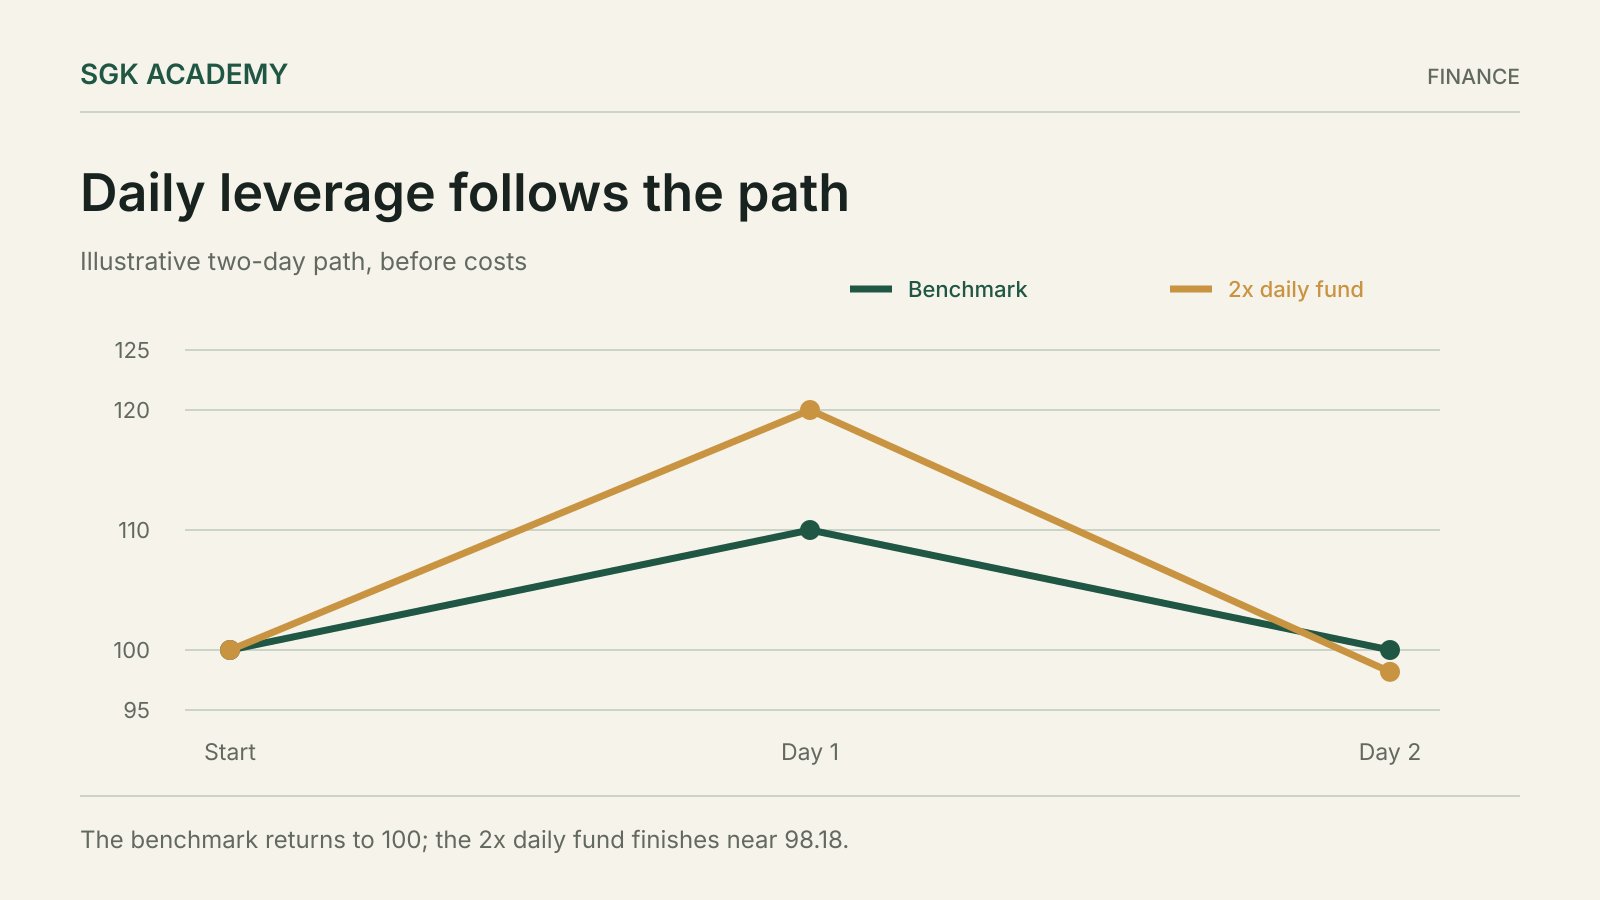
Start an illustrative benchmark at 100. On day one it rises 10% to 110. On day two it falls by about 9.0909%, returning to 100.
A perfect 2x daily fund starting at 100 rises 20% to 120 on the first day. On the second day it falls by about 18.1818%, ending at approximately 98.18.
The benchmark is back where it started, while the leveraged fund is down about 1.82%. The fund achieved twice each daily return in the example. It did not fail its daily objective.
| Point | Benchmark | Illustrative 2x daily fund |
|---|---|---|
| Start | 100.00 | 100.00 |
| After +10% benchmark day | 110.00 | 120.00 |
| After −9.0909% benchmark day | 100.00 | 98.18 |
The changing base is the reason. A percentage loss on 120 is a different amount from the same percentage calculation applied to the original 100.
A sustained rise produces a different path
Now let the benchmark rise 5% on each of two days. It moves from 100 to 105 and then to 110.25, a total gain of 10.25%.
The perfect 2x daily fund rises 10% each day, moving from 100 to 110 and then to 121. Its total gain is 21%, slightly more than twice the benchmark’s two-day gain of 20.5%.
This example matters because the mechanism is not a rule that leveraged funds always lose value over time. Compounding depends on the sequence of returns. Trending and fluctuating paths can produce different relationships.
That does not make a favourable path predictable. It means a long-term result cannot be calculated simply by multiplying the benchmark’s total return by the daily leverage factor.
Inverse exposure has the same time-period problem
Consider an illustrative −1x daily fund. If the benchmark rises 10% on the first day, the fund falls 10%, from 100 to 90.
When the benchmark then falls about 9.0909% to return to its starting point, the inverse fund rises about 9.0909% from 90, reaching approximately 98.18.
The benchmark’s total return is zero, but the inverse fund has lost value. A reader expecting the exact opposite of the benchmark’s total return over the two days would be disappointed even though the daily objective was met.
An inverse fund is therefore not automatically a set-and-forget hedge. The hedge ratio, holding period and changing values need attention, along with costs and the relationship between the benchmark and the exposure being hedged.
Write the return calculation as a product
For a daily leverage factor L and benchmark daily returns r1, r2 and so on, the simplified cumulative fund value is the starting value multiplied by each factor of 1 plus L times the relevant daily return.
The benchmark’s cumulative return instead multiplies the factors 1 plus each daily return. Multiplying the final benchmark return by L is a different calculation.
A spreadsheet can make this clear. Use columns for date, benchmark return, benchmark value, assumed fund return and fund value. Apply each return to the previous day’s value.
Label the model as idealised. Real funds may use derivatives, incur financing and operating costs, and differ from the target. The spreadsheet explains daily compounding; it is not a simulator of every product feature.
Keep costs outside the leverage shortcut
The daily target is typically an objective before some costs and expenses, depending on the product’s documents. Read how fees, financing and transaction costs affect the result.
A fund can also have tracking differences, trading spreads and premiums or discounts in its market price. An investor buys and sells at market prices, not necessarily at the exact value used in a simplified chart.
Our investment fund fee guide explains how to trace the full cost chain. For a leveraged product, the mechanics of exposure and financing make that exercise especially important.
Do not compare a leveraged ETF’s headline fee with an ordinary fund’s fee and assume the difference captures all additional risk or cost. The strategy itself changes the exposure.
Distinguish a trading view from a funding need
A person taking a short-term view on a benchmark has a different objective from someone saving for a house purchase or maintaining an emergency fund. A daily leveraged product should be assessed against the actual purpose.
If the money must be available for a fixed obligation, amplified price variation can conflict directly with that need. A potential high return does not make the required spending date flexible.
If the purpose is a hedge, identify the exposure being hedged and the period. A product tracking a broad index may not offset a concentrated portfolio in the way the investor expects.
The decision requires more than a prediction that the market will go up or down. It requires understanding how the instrument behaves while the position is held.
Single-stock and specialised products add concentration
The SEC bulletin discusses single-stock leveraged and inverse ETFs as an additional layer of risk. Exposure to one company lacks the diversification of a broad benchmark, while leverage amplifies the relevant movements.
Other specialised products may reference futures or assets with their own market structure. The underlying exposure can differ from the simple price chart a reader has in mind.
Read exactly what is tracked. A futures-based benchmark and the spot price of an asset are not automatically the same return series. The product documents should explain the benchmark and implementation.
Avoid assuming that the familiar ETF wrapper makes every product similar to an ordinary diversified index fund. The wrapper does not remove the strategy’s concentration or leverage.
Stress-test the amount, not only the percentage
Suppose an investor places €5,000 in an illustrative 3x daily exposure. A one-day benchmark decline of 8% corresponds to a 24% target decline before costs under the simplified assumption, or €1,200.
The same percentage exposure on €50,000 would mean €12,000. Convert the scenario into money and compare it with the purpose of the funds and the investor’s capacity to absorb loss.
Also consider the possibility of gaps, market disruption and a result that differs from the ideal target. A stop instruction is not a guarantee of execution at the chosen price in every market condition.
This is not a prediction of a particular day’s movement. It is a way to test whether the position’s consequence is understood before the position is opened.
Review the position with the product’s actual objective
If a reader chooses to use such a product, the review should focus on the benchmark, daily objective, holding period, position size and reason for continuing. A long-term label attached to the account does not change the fund’s reset mechanism.
Avoid explaining every loss as a temporary tracking error. The difference may be the expected result of daily compounding under the realised path.
Keep a record of the original purpose and exit conditions. If the position changes from a short-term trade into an indefinite holding because it has fallen, the investment decision has changed and should be reassessed.
The arithmetic is worth doing before any purchase. If the path examples feel surprising, spend more time with the objective and risk disclosures before treating the multiplier as a simple way to obtain more of an ordinary fund.
Build a four-column worksheet before taking a position
Use one row per day and four core columns: benchmark return, benchmark value, assumed leveraged return and fund value. Start both value columns at the same number. Calculate each new value from the previous row, never from the original starting amount.
Add the return since inception for both columns and compare the fund’s result with the simple multiple of the benchmark’s cumulative return. The difference becomes visible as the series grows.
Try a smooth rise, alternating gains and losses, and a sharp decline followed by a recovery. Keep the daily target fixed so that the effect of the path is isolated. Then add an explicit cost assumption as a separate layer.
The exercise should make the product easier to explain in your own words. If the intended holding period is several months, inspect the full path over that period rather than selecting the most favourable two days. Keep the worksheet’s assumptions beside the output so that it cannot later be mistaken for a backtest of a real fund.
Check whether the figures you download are price returns or total returns including distributions. Mixing those series can create an apparent tracking problem that comes from the worksheet itself. Use a consistent return definition before interpreting the difference as evidence about a fund.
Questions
Will a 2x daily ETF return twice the index’s annual gain?
Not necessarily. Its objective concerns daily returns, and compounding makes the longer-period result depend on the path.
Can a leveraged ETF lose money when the benchmark ends flat?
Yes. The two-day example shows that daily gains and losses can leave the benchmark unchanged while the fund loses value.
Do leveraged ETFs always decay?
No universal result follows from that phrase. Trending and fluctuating paths behave differently, while costs and product mechanics also affect outcomes.
Is an inverse ETF a permanent hedge?
It should not be assumed to be one. Daily resets, changing values, costs and the match to the underlying exposure require analysis.