Investment fund fees include more than the fund’s headline ongoing charge. Platform costs, transaction costs, dealing spreads, currency conversion and the way you invest can all affect the amount you keep. Compare the complete route from cash to investment and back, using the same holding period and assumptions for each option.
ESMA’s March 2026 report offers a useful reason to do that work yourself. Falling average costs do not mean that an existing investor’s own fund became equally cheaper. Product choice, share class and distribution arrangements still matter.
Read the report’s date and its data period separately
On 3 March 2026, ESMA published findings from its 2025 costs and performance report. The release describes developments in 2024. It should not be read as a measurement of returns earned during March 2026.
ESMA found that cost reductions were driven largely by new funds entering the market, with more limited reductions for longstanding funds. That distinction matters to someone who already owns a product: an industry trend does not automatically change the charges on their statement.
Use the report as context, then examine the actual fund and platform documents. Check the relevant share class, currency, distribution arrangement and date of the fee schedule. Similar fund names can lead to different costs.
Avoid selecting a product because a category performed well in the report’s historical period. The fee comparison and the investment decision are separate tasks. Lower costs do not make an unsuitable exposure appropriate.
Draw the full cost chain
Start with the cash account and follow the investment process. You may pay to convert currency, place a trade, hold the asset, receive certain services and eventually sell or transfer it.
Inside the fund, ongoing charges and transaction costs can affect returns. Outside it, the platform may charge a percentage, a flat subscription or dealing fees. An ETF also trades at a market price, so the bid-ask spread and any premium or discount can matter.
Some costs appear as explicit deductions. Others are reflected in the price or net asset value. A statement with few visible fees does not prove that the investment is inexpensive.
| Cost layer | What to find | Useful comparison unit |
|---|---|---|
| Fund ongoing costs | Current share-class document | Annual percentage and estimated euros |
| Fund transactions | Disclosed transaction-cost information | Method and period covered |
| Platform | Percentage, flat fee, minimum and cap | Cost at your portfolio size |
| Trading | Dealing charge and spread | Cost per planned purchase or sale |
| Currency | Conversion charge and exchange-rate treatment | Cost for the actual currencies |
| Exit or transfer | Applicable terms | Cost of leaving the arrangement |
Do not add figures blindly. Check whether a quoted total already includes another line, and avoid counting the same cost twice.
Convert percentages into money
A 0.20% annual charge on €20,000 is about €40 if the balance stays constant. A 1.00% charge on the same amount is about €200. The difference is €160 for that simplified year.
Actual charges may accrue daily against a changing balance, and returns will not be constant. The calculation is still useful because it translates small-looking percentages into a number you can compare with other expenses.
Do the same for a flat platform fee. A €60 annual charge is 0.60% of €10,000, but 0.06% of €100,000. The product that appears cheap for one portfolio size can be expensive for another.
If you are comparing a percentage platform fee with a flat subscription, calculate the crossing point. For example, a hypothetical €120 annual subscription equals a 0.30% fee at a €40,000 balance, before any caps, dealing costs or service differences.
Show compounding without pretending to forecast returns
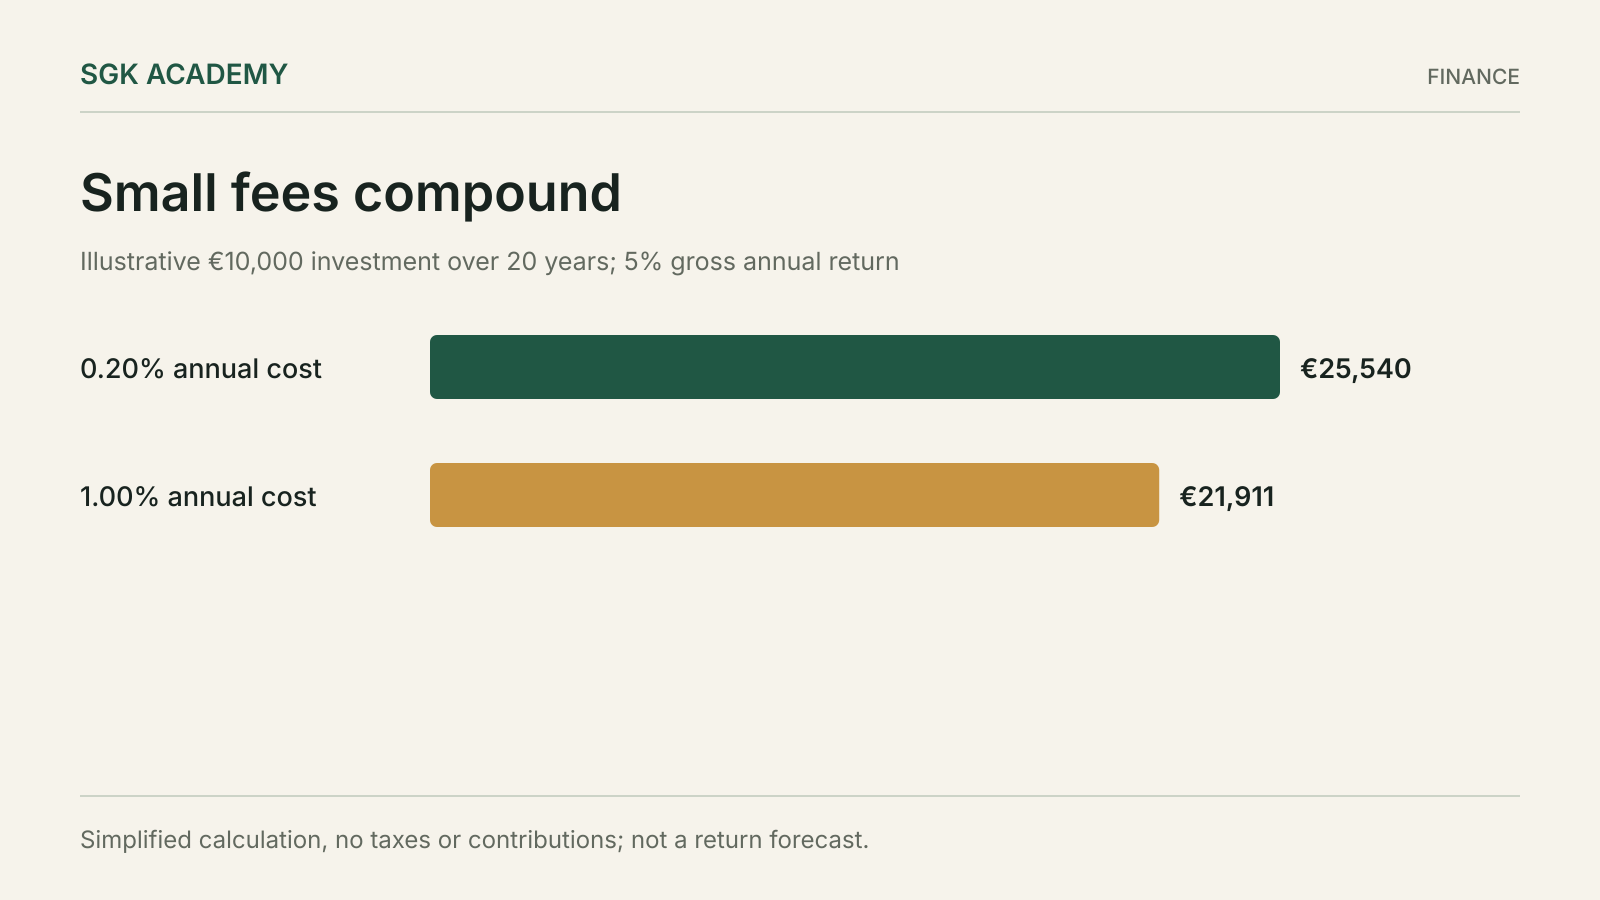
Consider an illustrative €10,000 investment held for twenty years. Assume a constant gross annual return of 5%, no contributions, no tax and a simplified annual deduction of either 0.20% or 1.00% from the return.
Under those assumptions, the lower-cost case grows at 4.8% and the higher-cost case at 4.0%. The approximate ending values are €25,540 and €21,911 respectively, a difference of about €3,629.
| Simplified scenario | Net annual rate used | Value after twenty years |
|---|---|---|
| Gross return before the modelled charge | 5.0% | €26,533 |
| Annual charge of 0.20% | 4.8% | €25,540 |
| Annual charge of 1.00% | 4.0% | €21,911 |
These are arithmetic scenarios, not expected market outcomes. Real returns vary, charges may be calculated differently and taxes can change the result. The example shows why recurring cost differences accumulate; it does not predict what a fund will earn.
The difference includes the return that could have been earned on money retained in the investment. That is why a twenty-year comparison is more than twenty times the first year’s fee difference.
Match the trading pattern to the platform
A low annual holding fee may be offset by expensive small trades. Suppose an illustrative platform charges €5 per purchase. Investing €100 each month would incur €60 in annual purchase fees, equal to 5% of the €1,200 contributed before other costs.
A different contribution schedule or provider structure may change that result, but the choice has trade-offs. Less frequent purchases change when money is invested. A platform with “free” dealing may charge elsewhere. Compare the whole arrangement.
Write down your likely behaviour rather than the cheapest possible behaviour in a marketing example. Include regular contributions, occasional withdrawals, rebalancing and currency conversions where relevant.
Also consider whether the platform supports the exact fund and share class you intend to buy. A cheaper account is not a useful comparison if it requires a materially different investment exposure.
Compare like-for-like investments first
A bond fund and an equity fund can have different expected risks and purposes. A lower fee does not compensate for choosing the wrong asset for the money’s intended use.
Within a category, compare the benchmark or strategy, diversification, currency exposure, distribution policy and structure. An accumulating and a distributing share class may produce different cash flows and tax questions even if they hold similar assets.
Tracking difference can be informative for an index fund, but it is a historical outcome that includes more than the stated fee. Do not treat one year’s tracking result as a permanent promise.
Separate the questions in your notes: is this the exposure I need, and is this an efficient way to obtain it? That prevents a fee ranking from quietly becoming an investment recommendation.
Read performance figures on the same basis
A chart may show returns before or after certain charges. It may assume reinvested distributions, use a different currency or cover a period that does not match your comparison.
Identify the start and end dates, the treatment of income and the costs included. If a platform shows the performance of a model portfolio before its own fee, subtracting no platform cost in your comparison will overstate what an investor keeps.
Inflation and tax answer additional questions. Nominal performance is not purchasing-power growth, and a pre-tax result is not an after-tax result. You do not need to build a complete tax model to notice that those layers are missing.
ESMA’s report is useful partly because it examines costs and net outcomes systematically. Your personal worksheet can be much smaller, but it should preserve the same discipline about definitions.
Decide whether switching is worth the disruption
Discovering a cheaper option does not automatically mean selling the current investment immediately. Consider transaction costs, tax consequences, transfer fees and time out of the market, as applicable.
Estimate the recurring saving and compare it with the one-off cost. A simplified €100 annual saving against €300 in transition costs suggests a three-year fee-only payback period, before taxes, returns and other differences. It is a starting calculation, not a complete decision.
A transfer without selling may be possible in some arrangements, but availability and fees depend on the providers and assets. Confirm the process rather than assuming it.
Keep the reason for a switch clear. Reducing an avoidable fee is different from changing investment strategy because of recent performance. Mixing the two makes it harder to assess whether the change achieved its purpose.
Keep a one-page cost record
Record the product identifier, share class, platform, current balance, expected contribution pattern, recurring charges and one-off costs. Link to the source documents and note when the fees were checked.
Add a short description of what each figure includes. This prevents a later comparison from treating a partial fee as an all-in cost. Where a cost cannot be estimated, mark it as unknown and explain why.
Review the record when the portfolio grows, a provider changes pricing or your transaction pattern changes. A flat fee that was unattractive at the beginning may become competitive later; a capped percentage fee can behave differently as the balance increases.
The useful result is not the lowest number on a comparison site. It is an understandable estimate of what your chosen investment route costs, why you chose it and what would make you reconsider.
Compare share classes by identifier
Two share classes can have nearly identical names while differing in charges, currency, income treatment or distribution arrangements. Record the identifier used by the provider, such as the ISIN where applicable, beside every figure in the worksheet.
When a comparison site and a platform disagree, check whether they refer to the same class and document date. Do not average the numbers or choose the lower one. Resolve the mismatch through the fund’s own documents and the platform’s terms.
For an existing holding, use the class shown on your actual statement. A cheaper institutional class found online may not be available through your account or may have different eligibility conditions. The comparison should use an option you can actually obtain.
Questions
Is the fund’s ongoing charge the total cost of investing?
No. Platform, trading, currency and exit costs may also apply, while some costs are reflected in prices rather than separate deductions.
Does a lower-fee fund always produce a better result?
No. Compare suitable, similar exposures first. Returns and risks differ, and lower costs cannot make an inappropriate investment suitable.
Why do small annual fee differences matter?
Recurring charges reduce the amount left to compound. The effect depends on the balance, time held, return path and fee method.
Should I switch immediately after finding a cheaper fund?
Assess one-off costs, tax consequences, transfer options and differences in exposure before deciding.